Time

Tuesday, November 17, 2015

酒田戰法

目錄

]

酒田戰法簡介

 日本K線的經典之首推“酒田戰法”,它的作者為本間宗久,生於日本十七世紀的享保九年(約1724年),本間宗久一生致力於米市行情之研究,著有《本間宗久翁密錄》,此配合另一本古典巨著《三猿金泉錄》,經過兩百多年來東洋人的精心研究,後來輾轉編輯為較現代化的“酒田戰法”。在此必須強調,書名的酒田戰法原作者並非姓“酒田”,而是為了紀念這位十七世紀的大企業家----本間宗久,以其出生地出羽(目前之山形縣酒田市)為名,故謂“酒田戰法”。
  酒田戰法經歷了兩個世紀半,至目前的科技昌盛時代且電腦全部出籠,但它仍然是這般光輝璀璨絲毫不受影響,其理由為它是先人的真髓,經曆數十年的心血研究才綜合成數十萬條萬世不朽的真章。當時的出羽市為十七世紀的商業鋪聚地,每天南來北往人潮交織,出羽交易以“米”為最大宗,而本間氏即投身於米市之研究前後達四十年之久。他對商品的行情波動,季節性,天候變化,戰爭飢謹,大戶心理,投資變化。。。。。。等可謂了若執掌,所謂“知己知彼,百戰百勝”,故“酒田戰法”已經成為目前證券和期貨業者的入門工具書。
  本間宗久不但聰慧而且膽識過人,他在出羽市發跡後不久即名聲大噪,當時人士即以“出羽之天狗”稱之。席卷關西市場的本間宗久此番再往首都江戶(東京)邁進,所到之處莫不萬人空巷,所預測之行情莫不百發百中,因此本間宗久瞬間成為萬人之神,也很快被當時的幕府天皇聘為財政首席(相當於資政)。享有一生榮華富貴的本間宗久,最後遁入佛門,在享和三年(1803年)去世,享壽七十九歲。

  1、疾如風。行情要反轉破位不對頭時趕快處置目前的部位。酒田戰法的四大指導原則

  2、徐如林。盤整時步調放緩,高出低進。
  3、掠如火。單邊的連續走勢,一路追殺絕不猶豫手軟,並抱牢賺錢的部位,只追加不平倉。
  4、不動如山。很多時候走勢不明,勉強進場不但難以圖利,還必須承受極大的風險,不如退場觀望。


1、築底階段酒田戰法的四個階段

  “酒田戰法”把底部比喻為深谷,谷底多有河流所以把“三重底”、“頭肩底”稱為“三川”,“雙重底”、“W底”成為“兩川”,“弧型底”、“半圓底”成為“鍋底”,底部橫向構築面積越大,代表上漲累積的動能越多,上漲的幅度也越大(有如大樓的地基越穩固,樓可以蓋得更高!)這一點與西方提出的“鐘擺效應”看法略有不同,“鐘擺效應”認為最低點到勁線的距離越大,上漲的幅度越大!兩者都很有參考價值,真理沒有高下之分,我覺得都有道理!
  2、上升階段
  本間宗久把這個階段比喻成人生的四個過程:
  1)幼兒期:這個時期有如幼兒學步,前進緩力而且一遇到害怕的狀況馬上退回母親的身邊,就像走勢的初步上升幅度不大、速度緩慢,稍微遇到阻力就馬上往回退!
  2)青年期:有如體力充沛的年輕人“衝勁十足”,拼命的往前沖而且跑的遠、跳的高,雖然沒有什麼耐力但遇到困難只要稍作休息“回檔整理”就能馬上再度發動新一輪的上攻!
  3)中年期:這個時期體力已經走下坡,但目標明確穩定性也比較好,人到中年難免比較保守些,有如行情的末升段,走勢穩健緩慢回檔幅度不大但方向相當清楚,很多散戶就是這個階段才開始追價!
  4)老年期:人到老“盛極而衰”終於走到了“強弩之末”開始用盡最後一絲的力氣也[無力回天]終告衰亡!
  3、構築頭部
  其實這個階段就是“上升階段的老年期”行情走勢企圖向上再度推升但多頭用儘力氣也沒辦法突破前一波高點,最後向下突破勁線完成頭部而進入“下跌階段”。本間宗久把下跌前的頭部統稱為“天井”,“三重頂”稱為“三山”,“頭肩頂”稱為“佛頭”有如佛像的頭部與左肩右肩,也有一說為“三佛頂”代表中間的是“如來佛祖”,左邊是“普賢菩薩”,右邊是“文殊菩薩”;“雙重頂”、“M頭”稱為“兩尊頂”,“弧型頂”稱為“鍋蓋”或“半圓天井”,相同的本間宗久也認為頭部橫向構築面積越大,代表下跌累積的動能越多,下跌的幅度也越大,有入拿一桶水往下倒,水桶越大裝的水越多,水往下的衝力就越大!
  4、下降階段
  該階段和上升階段的道理一樣,只是方向相反。


  酒田戰法的原版書《本間宗久翁密錄》,其中並無任何圖形,僅是一百多條有關條文式的記載,經過一兩百年來東洋人的再三研究後,終於在昭和二十四年出現第一本圖型版本——證券賣買的密寶,合計78條戰法(圖型為70條,不含圖形8條),併在標題下方例出“買”,“賣”,“暫觀”或“轉換”以為明示,以下即為酒田戰法的密芨說明:
酒田戰法說明

  戰法1
酒田战法
  買——大幅開低收高的陽線,此為漲勢訊號的一種,依其陽線的長短另有中陽線小陽線等,從其陽線的長短幅度可能臆測出當日的漲勢強度。
  戰法2
酒田战法
  賣——大幅開高收低當日以“長黑”收市,此為跌勢訊號的一種,依其陰線的長短另有中陰線小陰線等,從其陰線的長短幅度可臆測出當日的跌勢強度。
  戰法3
酒田战法
  賣——續前日的大陽線之後開高收低,收在前日陽線之中,如陰線收越低表示賣力愈大,如接近前陽線的開盤位置時,此時表示市場賣壓甚大應轉買為賣。由於陰線幾乎覆蓋前陽線故而得名,通常陰線伸入陽線部分如超過二分之一,此即表示可以轉為拋售。
  戰法4
酒田战法
  暫觀——開、收盤均在同一價位上,但上下方各冒出長短不同的影線,依(1)~(4)的名分分別為:十字星長十字星、T字線、倒T字線、十字星和T字線,倒T字線皆為“轉換線”,長十字星則為“多空分歧”。
  戰法5
酒田战法
  暫觀——超短的陰線或陽線稱之,最沒有行情的時候常會出現這種極短線,日本期貨商品的粗糖和大豆在最牛皮的時候,有時候出現長達一兩個月的極短線,此時市場人氣最為渙散。極短線如突然出現在一般走勢中,此表示正處於不明朗的“多空分歧”。
  戰法6
酒田战法
  買、賣——前後的幾支日線連續上下排列,即翌日開收盤皆在前日的價幅之中(陰陽線不論),但是中間絕對不開窗,這種排列不論上升或下降都是走穩健步伐的。平時三、五支日線連在一起經常可見,有時甚至多達八支或十支,對於連續線有一簡單臆測法,如在天井圈出現連續五支陰陽線夾雜而下,此即為不久市場將下挫的徵兆,而脫出盤檔後如連出三支這種線型而且創新高(低)價時,此刻應迅速獲利了結或暫行回補買入。
  戰法7
酒田战法
  買、賣——第二天的陽線開盤切在前日之最低點(含影線在內),此屬於看漲的訊號;反之如果陰線開在前日最高點而往下收黑,此為“下挫”的訊號。切入線為酒田戰法的主要線型之一,往往在接切入線之後隨即有大行情出現。
  戰法8
酒田战法
  買——在一連下挫之後,最後出現一支長下影線的小陰線欲試探底部,故稱為“探底線”,通常下跌一個月之後如出現此一線型有可能反跌為漲,故探底線為“止跌”的訊號,翌日的行市發展須隨時留意之。
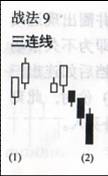
  戰法9
酒田战法
  賣、買——三連線有上升三連線和下降三連線之別,(如圖中1,2),在高價圈連出三支陽線之後,多頭應及時獲利了結,反之在低價圈之後連續出現三支的陰線,此刻空頭應暫時回補買入,先獲利一段再靜觀其變。
  戰法10
酒田战法
  賣、買——翌日的大陽線大陰線將前日的小陰(陽)線環抱住,此為一種極佳的買勢訊號或賣勢訊號。如在高價群出現可以拋出,反之在低價圈出現時可以買進。在長期上升走勢中,如最後出現環抱陽線則可以買進。
  戰法11
酒田战法
  買.賣——跳空英文稱“gap”,是屬於一種逐漲和逐跌的訊號,如出現在牛皮盤檔之後且連出三支時其威力最強,跳空有上跳空和下跳空之別,都是屬於暴漲和暴跌的先兆,通常在一種大行情發動時,出現跳空如一周內不回補即可能往上直線竄升,因此多頭可利用出現跳空之際迅速行低價買入(下跳空的情況則反行拋售)。
  戰法12
酒田战法
  賣——第二支日線從第一支日線中孕抱而出故而得名,圖中不論陰孕陽(1)或陽孕陰(2),皆屬於長勢漸弱的明證,尤其在上升途中先出大陽線後再急劇縮成小陰線,抑或在下跌途中原為大陰線,翌日再急劇縮小為小陰線,這都是走勢漸弱的先兆。陽孕陰的情況,得看翌日是出開高陽線抑或開低陰線才能夠有所決定。
  戰法13
酒田战法
  賣——第三支日線開低但是卻收在第二天陰線的影線之下(正好相切),這種線型屬於拋售的訊號之一。

  戰法14
酒田战法
  賣——為迫切線的延長,即第三日的陽線收盤更深入前日的日線之中,此可以看出多空頭曾激烈交戰過,如日後走勢再探下位,空頭可乘勝追擊之。
  戰法15
酒田战法
  賣——黑三兵的出現為行情崩落的前兆,如連續一個月的上升走勢,在上端出現此一線型時,不久將大幅崩潰,甚至隨後即一連下挫一個月以上。黑三兵的相反為“紅三兵”(參閱戰法(69)三兵部分),為大漲的訊號之一。
  戰法16
酒田战法
  轉換——兩支極短線銜接在一起稱之,二星為行情轉變的徵兆,如圖中之出現上竄的連續星線,多頭可以加碼買入。
  戰法17
酒田战法
  賣——三支極短線串連在一起,和二星一樣仍然是屬於多空分歧的訊號,如出現圖中下落三星時,空頭可以乘勝追擊之。
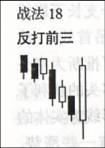
  戰法18
酒田战法
  賣——最後出現的一支陽線,可以包絡先前的三支日線(陰陽不論),從它的逐漸下落型態突然出現一支陽線扭轉頹勢,此看來似乎屬於買入的訊號,其實它反而是一種“轉賣”的契機,多頭必須特別註意。
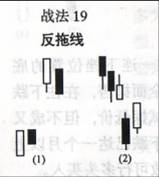
  戰法19
酒田战法
  買、賣——反拖線可分為兩種型態,一是上反拖,另一種是下反拖。所謂的反拖線即原來屬於朝上或朝下的走勢,突然出現一根陰線或陽線將整個局勢扭轉過來,此反有助於原本的上升(1)和下跌(2)型態,在反拖線出現之後,(1)的上升反拖線仍將持續上漲,而(2)的下跌反拖線仍將持續下跌。故上反拖為“買入”訊號,而下反拖為“拋售”訊號。
  戰法20
酒田战法
  賣——在上升走勢中,突然出現一支長下影線高懸在上,這種線形即稱為“弔首線”,此為買勢受挫的訊號。此一圖型可推斷為空頭一時性回補故將價位拉高,但多頭的獲利了結導致下端拉出甚長的影線(影線為實體的三倍)。弔首線跳空看來似乎還有一些漲勢,但此為“騙錢”型態之一,多頭決不貿然進場,否則將立刻被套牢
  戰法21
酒田战法
  買——此為弔首線出現在一連下挫位置的底部,多頭在此地幾乎以全面拋售,再往下跌已不可能。雖然曾一度試探低價,但不成又告縮回故收弔首線,如下跌已達一個月以上更可確認行市將反轉,故可行多頭買入。
  戰法22
酒田战法
  暫觀——一陽一陰交錯其間,然後再出現一支略微下降的陰線,如再出現一支陰線將成為“黑三兵”,然僅兩支陰線無法臆測其走向將如何,不過如果上升走勢已連走了一個月而再接這種線型的話,此時行市大都已達天井,今後能否再度上揚,得隨時留意市場成交量和未平倉的結構變化。
  戰法23
酒田战法
  賣、買、暫觀——第二支十字星為前面大陽線所包絡,此時市場買勢突然陷入膠著,如果此刻在高價圈階段的話,那麼大概是警告已達“天井”的訊號,此時應迅速轉多為空才是良策。平常如出現這種線型,應視為多空分歧的關鍵,多頭在此必須考慮是否再度出擊。反過來言,如果十字星為大陰線包絡的情況,而此刻又出現在底價圈時,此反而是一種買入契機。
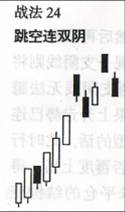
  戰法24
酒田战法
  賣——圖形中可看出,在上漲過程中不但出現跳空雙陰,而且不出一兩天又再度出現同樣雙陰,這種線型在K線走勢中甚少出現過,第一次出現時仍然可持續多頭買入,但第二次出現時空頭可能將展開大反攻,故此為行情崩潰的訊號之一。
  戰法25
酒田战法
  賣、分歧——一種波濤洶涌欲掀起大浪之勢,到最後看兩支日線的發展情形,第一支為小陽線上下影線甚長,此表示在上升過程中漲跌都受到限制,故收實體甚小的小陽線,這種線型出現到此為止表示“攻防分歧”,多頭和空頭都必須休戰片刻,翌日的開盤如何為最重要關鍵,但翌日仍然無大發展僅出“孕出線”而已,故整個大漲之勢到此即告中止。浪高線的尾端如出現長上影線,此表示這一波漲勢已達天井,故多頭必須迅速獲利出場為妙。
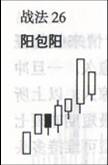
  戰法26
酒田战法
  賣——最後一支日線為第二支陽線所包絡,此為漲勢縮小的證明,尤其當出現在上升走勢時,可能將形成天井,故在這個時候多頭應立刻平倉為宜。
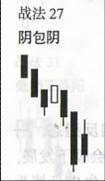
  戰法27
酒田战法
  買——和上面的陽包陽的情況完全相反,當位於下降走勢中,最後的一支陰線為第二支所包絡,此為賣力縮小的明證,這個時候形勢可能接近底部,故空頭應立刻行回補買入,多頭在此刻亦可迅速行低價買入。除了上述的陽包陽和陰包陰的狀況外,在上升途中也會出現“陽包陰”或下落途中出現“陰包陽”的情況,二者皆視為攻防分歧,日後走勢將如何還不得而知,須視下一支日線以後的發展而定。
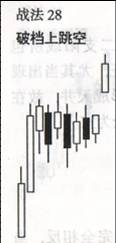
  戰法28
酒田战法
  買——破檔上跳空為大行情來臨的徵兆,尤其它的牛皮盤檔愈久,一旦衝出牛皮其威力往往十分驚人,以上所述為長期牛皮檔,如屬最短期亦須七至十一支,遇到這種線型可維持多頭買入方針。
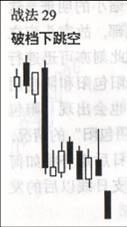
  戰法29
酒田战法
  賣——為破檔上跳空的相反型態,一旦衝出牛皮檔往往行情會朝下發展,故空頭可乘勝追擊之。牛皮盤檔為期不一,最小的亦須一周以上。圖中的破檔朝下再朝二段下降發展,先前的牛皮即可謂“盤檔整理”,一旦遇到這種典型利空訊號,空頭可持續回升高價拋售。
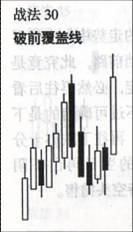
  戰法30
酒田战法
  買——圖中的第七支陰線覆蓋第六支日線,隨後經過了數天的回落,再出現一大陽線破前覆蓋先記錄,此暗示行市將續朝多頭市場發展,故可以再次買入。
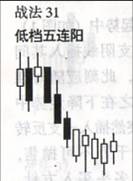
  戰法31
酒田战法
  買——在下降走勢中突然出現連續五支的陽線,此為買方誓死防禦,致使得空頭有些招架不住之感,通常在這種線型出現之後空頭常會認敗回補,隨後即造成價格之大幅上升。
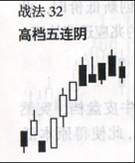
  戰法32
酒田战法
  賣——在上升走勢途中突然出現五支連續陰線,此為行市看壞的明證。在上端連出五陰線,此表示空頭固守陣線不稍退讓,隨後多頭可能將了結拋售,更導致空頭的乘勝追擊之。
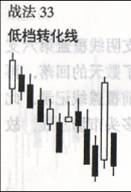
  戰法33
酒田战法
  暫觀——原以為下挫的走勢中,突然冒出一支大陽線阻擋前路,此究竟是喜還是憂無法確定,必然再往後看銜接什麼日線,不過可確信的是下挫之勢已受阻礙,再往下跌亦十分有限。如依圖中的翌日再出下陰線,此依然可續持空頭拋售。
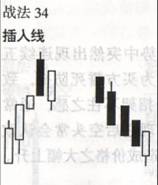
  戰法34
酒田战法
  買——在上升起勢中(如圖1),突然出現一支陰線插入其間且位置稍低,此刻應隨時準備轉賣;反之在下降走勢中(如圖2),突然插入一支反轉陽線,此刻千萬不可拋售,應準備改行多頭買入方針。如連出十支創新低價時,此為行市反彈的徵兆應迅速搶買。
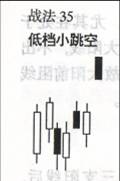
  戰法35
酒田战法
  買——在低價圈中小幅牛皮盤檔,突然出現一支跳空小陰線,此使得原本低迷的市場為之一振。一般出現這種小陰線,往往隨後會有一連六天的上漲,雖然這隻是個小上漲訊號而已,但空頭還是暫行回補的好。如果是小陰線上端出現較長的影線,此表示上升曾遭遇一些阻力,如此一來往上躍升的機會會比較小些。
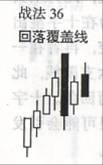
  戰法36
酒田战法
  賣——圖形最後第三支出現大陰線,此幾乎包絡了前面的上升走勢,但翌日又回落縮小形成“孕出線”,然後再以稍高的黑線覆蓋其上,象這種情況出現時,屬於拋售的訊號之一,尤其當出現在高價位時應立刻搶拋。
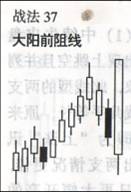
  戰法37
酒田战法
  賣——在一連上升走勢中,先出現兩支回落陰線,原以為可能再出現一支陰線形成“黑三兵”,但是不料卻出現大陽線擋住去路,一般人會誤以為這是一種大漲訊號,其實不然。因為這種一鼓作氣冒出的大陽線經常屬於“騙線”,尤其在處於高價圈時常出現這種大陽線,不出數日立刻行情崩潰,故大陽前阻線為“大跌”之前兆也。
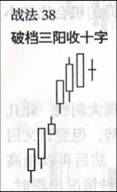
  戰法38
酒田战法
  賣——在破檔朝上連出三支陽線後,第四天突然冒出十字星,此為空頭拋售的千載良機,因為在十字星出現後可能迅速回補前空,再者在一連上升的走勢中連出六支陽線,此亦容易引發高價警戒而回落。十字星後翌日如再開低,很可能會引發多頭大拋售而行市崩潰。
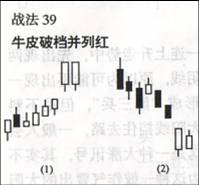
  戰法39
酒田战法
  買、賣——圖(1)中續牛皮盤檔之後出現上跳空且併列紅的現象,此線型的兩支併列陽線幾乎等長,原來上跳空即為“上漲”訊號,連出兩支情況更佳,如果翌日再大幅開高的話,此將成為“千里駒”的型態今後可以大舉買入也。而例(2)的情況正好相反,為牛皮下空連出兩支陽線的情況,兩支陽線不等長呈縮小之勢,這種線型屬於“加拋”訊號的一種,空頭應乘勝追擊之。
  戰法40
酒田战法
  賣——在一連的下落走勢中,突然跳空而下連出兩支陰線,此為行市大崩潰的前兆,空頭應全力追擊之。從圖形中可看出,在初次下跌過程雖遭遇小幅阻撓(小陽線),但是隨後即肆無忌憚再出下挫雙陰線,再接下跳空的雙黑之後多頭已潰不成軍,故在這個時候空頭應把握機會直搗黃龍。
  戰法41
酒田战法
  買——紅三兵為大漲訊號,和黑三兵正好是相反,當紅三兵出現在底部位置時其漲勢最為凌厲,故多頭可傾全力出擊。
  戰法42
酒田战法
  賣——一樣是紅三兵,但到第三根時已漲勢受挫收小陽線且上端出現影線。這個情況可視為“買力出盡”,故已進場的多單應立刻獲利了結,且改弦易轍行高價拋售方針。
  戰法43
酒田战法
  暫觀——黑三兵的排列並非由上而下,而是中間突出兩邊較低呈“川字”排列,這種情況在下降過程中不宜再拋售,應暫時觀望一下再作行動。
  戰法44
酒田战法
  暫觀——為上述川字三黑的相反排列,黑三兵一上一下的排列亦不適宜看空,應暫時持觀望態度為佳。
  戰法45
酒田战法
  賣——在上漲過程中買力特別旺盛,接大陽線之後跳空而上出現小陰線,翌日開低然後大幅下瀉收長黑,此小黑高掛的情況東洋人取名為“夜星”,屬於拋售的徵兆之一。
  戰法46
酒田战法
  賣——和夜星情況頗為類似,仍然上跳空後連出兩支黑線的情況,此為上漲途中買力已盡,故在第三支日線即呈倒退之勢,這種線型出現後有利於空頭拋售。
  戰法47
酒田战法
  買——排列和夜星正好相反,夜星的星星屬於“高掛”而晨星因破曉已盡,故中間的小陰線呈“低掛”姿態,在小陰線出現之後再跳空的大陽線,此為行情將大漲的訊號,故多頭可全力反擊之。
  戰法48
酒田战法
  賣——這個圖形和前面夜星十分相似,所不同僅中間的小陰線改為“十字星”而已,故稱為十字夜明星,它屬於跳空上漲後開收盤都在同點,由於出現十字線上下影線)之故,因此在這兒形成轉換線,翌日出長黑即可確定今後行市將再度下挫,十字夜明星和晨星一樣同為“拋售”訊號,空頭可一併出擊之。
  戰法49
酒田战法
  賣——線型和十字夜明星幾乎完全一樣,僅中間為中黑線,但隨後的長黑立刻回補前空,這種型態為賣力將接踵發生,今後行情可能再朝下發展,故可維持空頭拋售方針。
  戰法50
酒田战法
  買——在連出雙黑之後賣力已漸式威,故第三支出現極短的日線,此為“回檔”訊號的一種,今後行市可能將反跌為漲,故多頭可乘低點買入。
  戰法51
酒田战法
  賣——在下落途中出現跳空而下的連續兩支小陰線,此為空頭乘勝追擊的大好機會,由於跌幅迅速可能很快會達到底部,因此得註意它的回檔反彈。下落二星原則上可以追加拋售,但隨時脫出底部亦須提防之。
  戰法52
酒田战法
  賣、買——和下落二星相似,在下落途中冒出三星,空頭亦可乘此機會加拋之,但隨時得註意它將抵達底部。如果情況相反,二、三星出現在上升途中的話,此反而是“加買”的大好機會。
  戰法53
酒田战法
  買——逆襲線和下放三星的狀況十分相似,也是在下跌走勢中遭遇極大阻力,由於多頭全面反撲故收大陽線阻障前路,這種線型一旦出現也容易底部反轉,故空頭在此刻應暫退一步為宜。
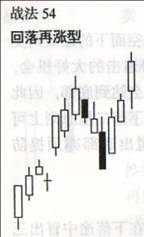
  戰法54
酒田战法
  買——在一波上漲聲中曾經跳空而上,但不出一周之內即立刻回補前空,然後連出三根陽線繼續上漲,像這種線型出現時也是利多訊號的一種。原本在出現大黑回補前空後,市場可能會一時性看跌,但紅三兵的尾隨其後已將看跌人氣吹得煙消雲散,故此刻應迅速轉空為多。
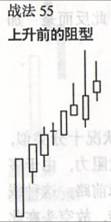
  戰法55
酒田战法
  賣——在一連上升的走勢中連出陽線,到出現明顯上影線時多頭必須特別謹慎。K線上的基本理論為,在上升走勢如連出十根陽線,此時走勢大都已步入尺井或必須回檔一下,圖形中的最後一支陽線已呈萎縮,此意味未來行市將轉為看跌,故此刻空頭看乘機尋高點拋售。
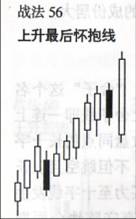
  戰法56
酒田战法
  賣——在一連上升之後,最後突然出現一支大陽線,幾乎環抱前面幾支日線的漲勢,乍看之下好象是一種上漲訊號,但最後多頭全力買進的結果很可能會引發日後的下挫。上升環抱線出現後必須確認它是否屬於“騙線”,如翌日開低時即可確認為騙線無疑,故可立刻改持空頭拋售方針。當然也有翌日開高的情況,但最後如果收陰線時仍然為看壞,故上升環抱線為“轉拋”線型的一種。
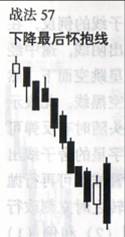
  戰法57
酒田战法
  買——和上升懷抱線正好相反,在一連下挫聲中最後出現一支超大陰線,此仍然必須確認它是否屬於“騙線”型態。翌日如大幅開高則可改持多頭買入,如果再開低的話必須暫觀一下,待確認下挫走勢無疑才可繼續拋售。但是通常在下跌途中連出七支陰線的話,很可能將引發底部反彈,故下降最後懷抱線出現時,一般還是“反漲”的成份居大。
  戰法58
酒田战法
  賣——這種線型甚少出現,“舍子”這個名稱也頗具其意,圖中之上舍子線即一連上升的走勢中,先出現開收盤同點的長十字星,隨後行市又告掉落,不但跳空且以長黑收市,此表示多頭的買力至十字線發生時已告枯竭,故此後得棄守陣地全面轍退。上舍子線出現後行市很容易下挫,故空頭應該乘勝追擊之。
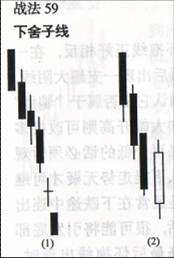
  戰法59
酒田战法
  買——此為上舍子線的例反,在下落過程中連出陰線,途中經過一天的十字星跳空而下,然後再度出現跳空黑線,此表示賣力已瀕臨盡頭隨時有反彈可能。尤其在十字星的舍子線出現後空頭必須警戒不可再行拋售,見底部翻轉之時立刻改行多頭買入。例(2)和例(1)情況相似,在下落過程出現黑三兵為不吉之兆,但十字星的舍子線出現時一切情形已改觀,故必須改行多頭買入。
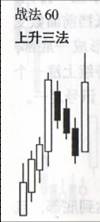
  戰法60
酒田战法
  買——三法包括:“買”,“賣”,“暫停”等三重涵意,先看上升三法的大幅上升乃至第四根大陽線,此即為買入的暗示,但隨後黑三兵出現卻指示可以拋售,再出現超大陽線穩住跌勢,此為暫停(休戰)的暗示,一個走勢中簡單地涵蓋了三種意義。上升三法出現時必須再靜觀片刻,如翌日開高可以加買。
  戰法61
酒田战法
  賣——為上升三法的相反型態,其中仍然包括“賣”,“買”,“暫停”三階段,最後一支大陰線撐住紅三兵漲勢,並暗示須冷靜一下,下降三法如翌日出開低陰線可以加拋。
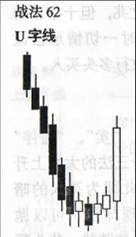
  戰法62
酒田战法
  買——在一連下跌之線急速由底部翻轉過來,有如一“U字型”排列,最後冒出的大陽線可抵擋前面數支日線的幅度,並迅速形成一底部,U字線一齣行情常會持續上漲一個月以上,故為“上漲”訊號之一。
  戰法63
酒田战法
  買——在一連下挫之後迅速達到底部,且最後一根以長黑收市有如擎天砥柱。通常跳空之後的日線達五支之多,其中陰陽線交互排列而下,第五支再出長黑,此表示落底已到盡頭,這種線型系是多頭的總拋售所造成,翌日如開高走勢將整個反轉過來,此有利於多頭買進。
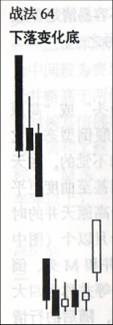
  戰法64
酒田战法
  買——此和擎天一柱底一樣,也是一種迅速落底的走勢,它在底部出現開高陽線,此有意回補先前的跳空(gap),但卻仍嫌不足,今後有可能行市再漲,在這種變化底中其底部通常包括五、六支小陰(陽)線,故一旦出現大陽線隨即立竿見影,下落變化底亦為買入的訊號之一。
  戰法65
酒田战法
  買——市場在長期低迷的時候,經常會出現這種線型,對於利空消息亦不太起作用,於是形成逐漸盤落然後在底部呈半圓底再緩緩上升,這種底部在美國稱為碟型(SAUCER),和W底、V字底、三重底等並稱為四大底部型態。鍋底型為期甚長,大鍋底有時長達半年以上,故鍋底的形成不容易清楚看見,它屬於“上漲”的訊號之一。
  戰法66
酒田战法
  賣——此俗稱為“和尚頭”或“高原天井”,為鍋底型的顛倒型態,它在形成之間也是不知不覺的,在天井亦是緩緩形成半圓甚至曲度更平緩些,當它被看出為高原天井的時候走勢往往走了三個月以上(圖中僅為略圖),這種天井等並稱為四大天井,一旦天井形成,隨後的行情下挫將為期不遠矣。
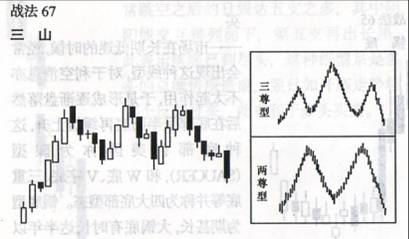
  戰法67
酒田战法
  賣——三山即所形成的天井型如三座高山,上圖上方為中間較為突出的三尊型,三尊亦稱為頭肩頂,中間的天井略高於兩側。三尊型為東洋人的典型稱謂,因日本古時候篤信佛教,中間一尊即代表如來佛,左右則分別為普賢和文殊菩薩,上圖的另一個型態為兩尊型,亦俗稱之為“M頭”,這三種天井的形成期都相當長(至少須半年以上),一旦天井形成,日後即將行情反轉。
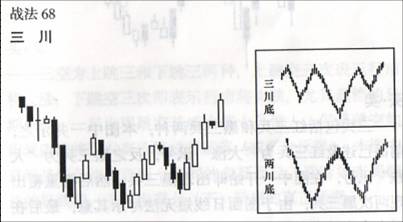
  戰法68
酒田战法
  買——三川為三山的相反型態,因形同三條河流故而得名,下方的上圖其中間底部較為明朗,此西方稱為“頭肩底”,東洋人則稱為“倒三尊”,倒三尊的形成期亦相當漫長,通常須半年以上才可見一漂亮的倒三尊。另一種底部為兩川(俗稱為W底),不論三川底或兩川底抑或鍋底,一旦底部形成不久即將行市反彈,故謂三川底為“上漲”訊號之一。
  戰法69
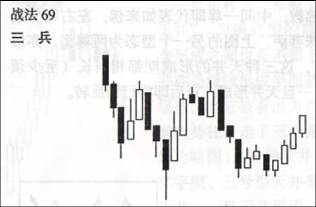
酒田战法
  買、賣——三兵包括紅三兵和黑三兵兩種,本圖中一併示之,前面已述及紅三兵為“大漲”訊號,反之黑三兵為“大跌”訊號,在圖中一開始即出現黑三兵,然後再重覆出現兩次黑三兵,由於圖面日線短無法盡示其意,最後在脫出牛皮後出現紅三兵,紅三兵出現後不久即將行市上揚。
  戰法70
酒田战法
  買、賣——三空為上跳三和下跳三兩種,上跳空三次表示行市將大漲,下跳空三次即表示行市將大跌,尤其盤檔的日期愈久,一旦出現跳空其威力將十分驚人,但是跳空如出現四次將引發高價警戒而回落(或低價反彈),本圖中日線甚短僅能代表兩個名詞的象徵而已,讀者如查閱較長的日線圖,當可發現上(下)跳空的真正涵意。
  戰法71
  買、賣——半日線如連收陽線可以買進,反之連收三日陰線可以拋售。
  戰法72
  出場——難平時刻千萬不可勉強支撐買進或拋售,否則一旦行情崩潰或往上直竄必當遭大敗。
  戰法73
  出場——亂線時市場走勢十分險惡,所謂亂線即上下波動幅度甚大,如三四天後仍然未能獲利,應迅速出場為妙。
  戰法74
  賣、買——連漲八天或十天的行情,此時必須註意其反轉下跌;反之連跌八天或十天,亦必須註意其回檔上升。周線如連出九支陽線應高價警戒。
  戰法75
  買、賣——遇到突然消息發生跳空上漲或下跌時應順勢買進,但出現“連續現”的情況則有待考慮。
  戰法76
  買、賣——低檔連出三日大陰線可以買進,高檔連出三日大陽線應迅速獲利了結。
  戰法77
  買——在上升走勢中常出現回檔三支或五支的現象,回檔三支可以買進,回檔五支應加碼買進。
  戰法78
  暫觀——由底部上升隨即出現大陽線,應等連出三支後再買進為佳,反之在天井下挫時亦等三支大陰線連出時再拋售。

Sunday, October 25, 2015

Options naked straddles: A more modest approach

For those who have been active in the markets for a quarter-century or more, it’s difficult to find anything unique. But when it comes to options, the list of strategies is enormous. These include such methods as bull put spreads, butterflies, iron condors, bear call spreads, straddles, strangles, etc. Then, there are variations. Here, we’ll look at one variation of the classic straddle called the scantily clad straddle.
The scantily clad straddle is a premium-capturing program that involves selling the straddle and then placing orders in the underlying commodity to provide a level of coverage should the underlying move significantly in one direction.
The scantily clad straddle can be used in any market that has options, including futures, forex, stocks and bonds.
For those new to options, a straddle is a trade that engages both at-the-money put and call options. If the S&P 500 futures are trading at 1,000, then selling the straddle would involve selling the 1,000 put and the 1,000 call. A long straddle would purchase both options. A straddle is usually a volatility play rather than a directional trade, with a long straddle betting on an increase in volatility and a short straddle, a decrease in volatility. Many trading platforms let you sell the straddle instead of executing each leg of the trade separately. By selling the straddle, you collect the option premium. You are thereby naked the straddle.
It’s nice to collect the premium, but the danger is that the underlying market will move enough that the option buyer can execute against you. When selling options, the exposure is technically unlimited. Taking the above example, if you collected 50 points for the straddle, but the S&P 500 dropped to 800, the put would then be worth at least 200 points and you would be down at least 150 points. At $50 per point, that’s $7,500. The loss could be more, depending on how much time value is remaining on the options.

Dressing up
The scantily clad straddle offers a level of protection for the options positions — thus, the position is no longer naked. Applying this to the previous example, if we got 25 points for the call and 25 points for the put, a pair of good until canceled stop orders in the S&P 500 would be appropriate (see "Protective orders," below). The orders would be:
  • Buy one S&P 500 E-mini 
at 1025 stop GTC
  • Sell one S&P 500 E-mini 
at 975 stop GTC
image
Once the straddle has been sold and the orders have been placed, there are three basic scenarios in which the trade makes a profit. In the perfect scenario, the market stays below 1025 and above 975. The trade collects the entire option premium on one side and part of or the entire option premium on the other side, depending on the close at expiration. If, in this case, the market closed at expiration at 1002, then the entire put premium was retained and 23 of the 25 points of the call premium were captured.
However, it is unusual that neither of the stops were hit. What normally happens is a trend develops in at least one direction during the trade’s life. In "Hit the stop" (below), it is assumed that the buy stop was hit and executed at 1025.
image
On the day of expiration, the market is at 1054. The call expires being worth 54 points. It was sold for 25 points, resulting in a loss on the call option of 29 points. However, you went long the S&P 500 at 1025, and it closed at 1054. The resulting gain on the S&P was 29 points. The long trade covered the call position. The other thing to remember is you collected all of the 25 points on the put. As long as the market remains above the put’s 975 strike price, the position will make money (see "On expiration," below).
image
Anything above 975 is profitable. Every price above 1000 achieves the maximum profit of 25 points ($1,250). If the market trends strongly in the direction of the initial stop, the trade will be profitable. Unlike other option writing programs that get hammered during a trend, the scantily clad straddle loves trending markets. It locks in the profit and covers the losing side.
Finally, instead of the market hitting your 1025 buy stop, let’s say it went down and engaged your sell stop at 975 and then continued down and closed at 900 on the day of expiration. You’d lose 75 points on the put (100 points value at expiration minus the 25 points collected in premium). But you’d also make 75 points on the short sale and wash out the put loss. Then you’d gain all 25 points on the call option because it expired worthless.
The downside
To my knowledge, there is no perfect system. Every trading method has losing scenarios, and this includes the scantily clad straddle. There are two basic situations where the trade loses money: Gaps and whips.
With a price gap, the market jumps past your stop and executes you at a worse price than you were expecting (see "Leaping to losses," below). In the chart, the market gaps past the 1025 buy stop and gets filled at 1041. This additional 16 points from the original stop costs you $800 more on the trade. In this situation, the trade still made money ($450) because the put expired worthless and you kept the entire $1,250 premium. But if it had opened at, say, 1060, the entire trade would have been at a loss. Because of this risk, it’s advisable not to use this strategy with commodities known to have locked limit days, such as lumber, hogs, corn, etc. It works best with liquid markets like the E-mini S&P 500.
image
Another scenario that ends in a loss is a whip trade. This occurs when both buy and sell stops are hit. When the second one is hit, then the entire trade is exited. This involves buying back the straddle. The resulting loss is dependent on how much time premium is left in the options. The earlier the whip occurs in the trade’s life, the bigger the loss, as opposed to a whip occurring with only 10 days remaining in the option’s life.
The most catastrophic situation is a whip with double gap fills beyond each stop. This would be an extremely rare occurrence, but it still must be considered a possibility as you evaluate this strategy.
Finally, because stop orders are being used, there will be times that you’ll get slippage (the order is filled at worse than your stop price). If, on expiration day the futures price closes near the strike, it may not be clear whether the option will get exercised. You don’t want to come in on Monday thinking you had a profitable trade only to find out you’re long the S&P 500 and it dropped Sunday night by 50 points. Sometimes, it’s better to buy back at least one leg of the option right before expiration just to avoid this scenario.
Be sure to cancel the related standing stop orders when the trade is completed. Also, if the futures month is not expiring, then the option is not a cash settlement, but the option is exercised and you’ll be long or short the underlying commodity.
There are situations in which the price might close just in the money for the option, but is not exercised. This happens because the option owner has several hours to make up his or her mind on whether to exercise the option. In after-hours trading, the commodity might move against the option owner to where it’s not profitable to exercise. When the price is close to the strike, it is best to exit the position. It will cost you a little, but will provide some peace of mind.

Bond trade
In Treasury bonds, the strikes are in full handles (129, 130, 131, etc.). The options trade in 64ths. T-bond futures trade on a quarterly cycle: March, June, September and December, but include serial options that trade every month. The November options are based on the December futures. Options expire the month before, meaning the November options expire in October.
In mid-September, the November T-bond option straddle with a strike price of 130 was sold. The December T-bond futures contract, the underlying for the November options, was trading around 129-28/32. The premium collected was 2-17/64 for the call and 2-23/64 for the put. This resulted in a total collected premium of 4-40/64, or $4,625. Once filled, two stop orders were placed:
  • Buy one December T-bond futures
 at 132-09/32 stop GTC
  • Sell one December T-bond futures 
at 127-20/32 stop GTC
The placement of the stop was equal to the distance of the strike price and the premium collected: Call premium of 2-17/64 plus 130 strike for a buy stop of 132 9/32; then 130 strike minus put premium of 2-32/64 for a sell stop of 127-20/32.
A few days later, the bonds moved higher and hit the buy stop at 132-09. The bonds continued their climb to 135-12. During this phase, we’re pretty happy with the trade. The call has been covered by the long position. If the bonds stay above the strike price of 130, now five points away, the trade will be profitable. Then the price started dropping and returned to the high 130 area. On November options expiration, December T-bond futures closed at 131-20. The results were as follows:
Call optionSold: 2 17/64
Expired: 1 40/64
P/L: +41/64 (+$640.63)
Put optionSold: 2 23/64
Expired: 0
P/L: +2 23/64 (+$2359.38)
Futures tradeLong: 132 9/32
Exit: 131 20/32
P/L: -21/32 (-$656.25)
ResultCall option: + $640.63
Put option: + $2,359.38
Futures trade: - $656.25
Total P/L: +$2,343.76
Other elements can be calibrated to fine tune the strategy, such as time frame and volatility. However, this basic concept is straightforward and successful.


Don't Get Caught Trading Options Naked

As you all know by now, I am a proponent of trading E-Mini futures.  It is an excellent trading environment for smaller investors because the Chicago Mercantile Exchange (CME) makes it a level playing field for one and all.  No matter how many contracts you trade, getting filled is still FIFO (first in / first out), which is not necessarily so with the New York Stock Exchange or the Nasdaq.  And there is only one exchange for each instrument, so there is only one price.  Again, not necessarily so with stocks or Exchange-Traded Funds.

I know that a lot of you use options in your portfolio but you haven't yet taken the plunge to integrate futures into your overall trading strategy. Today I have a way that you can use both to put your money to work while protecting your capital.

The Way the 'Big Guys' Trade


Trading E-Mini futures is not just for smaller investors.  It is also used by larger investors to protect their trades.  How does this work and, more importantly, how can you use E-Minis to protect your options positions?

If there were one word that could describe trading options, that word might be"insurance."

If you look at many of the option strategies, they are designed so that, in some way, you invest in both calls and puts to protect your investment.   Trading just one side (either up or down) is considered risky.

When you short a call option, for example, but don't own the underlying instrument, the option is described as "naked" -- or "uncovered" by a long position to protect you if the position moves against you.

Why would you short (or "sell to open") a call or a put? Many investors do this because you receive a credit upfront. That is, you receive money at the outset of your trade, with the goal being that the option value decreases over time, allowing you to keep most (if not all) of the money you collected. This strategy depends on the underlying security moving in the "right" direction, or not moving at all.

But what if the position does not go your way? With stock options, you can typically exit your option trade at any time, so you don't have to be stuck in a position that's not working for you. But when the market, and the underlying stock, moves very quickly, it's important to have a safety net to "cover" your position.

Brokerages frown upon investors trading uncovered options.  If the price of the underlying asset moves in the opposite direction than you expected, meeting your financial obligation might result in substantial loss to you.

But if you have to purchase some kind of an "insurance policy" for every option trade (i.e., buying a call in the opposite direction against the put you already own), it provides a layer of much-needed protection. However, buying protection can cut into your profitability.

Another Way to Hedge


Enter the S&P 500 (SPX) E-Mini futures.  Here's an insider's tip on what the big boys do to cover their potential losses.

Since the middle of July, the Chicago Board Options Exchange (CBOE) put/call ratio has been plunging.  It is now down at its lowest levels since March.  March is when the S&P 500 moved up considerably.

The CBOE equity put/call ratio demonstrates the trading volume of put options vs. call options.  When the put/call ratio is low, market sentiment is very bullish.  Because the market has been flying back up, larger investors have been capitalizing on the run by purchasing SPX call options.

However, on the remote chance that the market does pull back, these investors are placing SHORT STOP LIMIT orders on the S&P 500 E-Mini futures.  The stop limit says, don't execute this trade unless the price falls so far that it hits the lowered limit price, at which time, execute my short trades.

Since the market has been steadily climbing, the short limit orders have not been getting executed, so it hasn't cost the big boys anything to buy call options.  By placing short stop limit orders on the S&P 500 E-Mini, if the value of their call options goes down due to bad economic influences, their short positions on the S&P 500 E-Mini will make their trading a wash.

While they won't make any money, at least they break even.

How do we know this is true?

Normally, Monday mornings tend to bring light trading in the S&P 500 E-Mini.  After all, it is Monday.  But on Aug. 17, 2009, by 8 a.m., more than 400,000 contracts had already been traded, and the S&P 500 E-Mini was down 22 points.

Why?

Japan's Nikkei Stock Index plunged 3.1% on poor economic earnings announcements, taking the Shanghai Composite (down 5.8%) and the Hang Seng (down 3.5%) with it.  The CBOE Volatility Index (the VIX, also known as the "fear index," as it is used as a measure of trader sentiment) shot up 14.9% to 27.89.

Because the Asian markets fell so heavily, they triggered the S&P 500 E-Mini to be down 22 points.  Those larger investors saw their short Stop Limit Orders get executed.  It was the first time in a long time that Short Limit Orders were hit.  And a lot of money was lost!

The bottom line? Anything can happen in the markets, and you must be prepared for it. Not every trade is going to be a winner, but with the right protection in place, you can walk away from the losers without losing everything.
Barbara Cohen
Contributing Editor