Time

Sunday, March 22, 2015

JOHN W. HENRY – AN AUTOPSY OF ONE OF THE GREATS

We’re starting to get a little morbid around here – first with the “Is Trend Following Dead?” piece a couple weeks back, and now an “autopsy” of sorts on what went wrong at John W. Henry’s self-named firm. Some of the sales teams in the industry may prefer to avoid discussing such subjects, probably thinking something along the lines that doing so will “scare away the customers,” but to hear that John W. Henry was shutting down his eponymous managed futures shop was the kind of news that draws us like a moth to a flame.
Here was an industry stalwart in every sense of the word. A man who helped put managed futures on the map, and helped his pocket book to the tune of becoming a billionaire. He is a literal Hall of Famer, having received the Futures Hall of Fame award (whatever that is) from the Futures Industry Association. This isn’t quite Paul Simon hanging up his guitar, or Steven Spielberg deciding to get out of the movie business – but it’s close in terms of shock factor in the managed futures space.
This raises one huge question - well, actually, it raises hundreds of questions - but the big one is this: what in the world happened? We don’t just mean this week in the announcement that he was done, either. What happened in the past 8 years to transform a behemoth into a blip on the radar? Where did John Henry go wrong? Eight years ago he was managing $3 Billion and on top of the managed futures world, with a hot young upstart called Winton measuring in at only about 1/3 the size of Henry’s managed futures empire.
John Henry Asset Trends
Why was 2004 the top for Henry, yet just a launching point for Winton and other billion-dollar managers?  But most importantly for investors - how can we learn to identify when a top-tier managers’ best days are behind them?
Did he take his eye off the ball?
Excuse the all too easy baseball pun here – but the easy answer for many is to say things started to go downhill when Henry started to stray from his managed futures roots and dabble in sports, buying the Florida Marlins, then Boston Red Sox, a Nascar team and an English soccer squad. If he had only spent less time analyzing pitchers and trying to hire the next Billy Beane – and instead spent more time researching new models and risk parameters for his CTA – then things might have been different… or so the logic goes. 
This would be exactly the kind of shift that an ongoing due diligence program is designed to catch, and something we wrote about not long ago in a newsletter. The general idea is that by staying in close contact with a manager, you can get a feel for when things might be going awry in a way that might impact performance. There is never a guarantee that you'll see the curve ball coming, but you've always got a better chance of it if your eyes are open. 
The problem is that this logic starts to fall apart when we look at just when Henry started these other business ventures, which, according to the Disclosure Document for the JWH programs, began as early as 1987:
“Since the beginning of 1987, [Henry] has devoted, and will continue to devote, a substantial amount of time to business other than JWH and its affiliates.” 
Even if we use the later date of 1998, according to a great 2007 blog post (they had blogs back then?) from the now-deceased Greg Newton (as if this story wasn’t morbid enough already), the shift of focus to include a sports empire doesn’t appear to have affected the performance (which held up until the end of 2004).
His heavy-duty distractions did not begin until he became involved in major league baseball… Henry bought the Florida Marlins in 1998. 
Maybe it’s the Boston Red Sox curse, which Henry supposedly lifted by bringing a World Series title to Beantown? He became involved there in 2002, and things have been bad on the managed futures side for most of the time since.
So while the brains of the operation shifting his focus to baseball seems like an easy due diligence red flag, the numbers don’t really support it as the cause of the decline. Regardless, any investor after the year 2000 would have known of this concern.
A more nuanced “taking his eye off of the ball” argument – and something to consider when conducting due diligence on a manager – is the number of programs in the stable. For JWH, the answer is: quite a few. There are 17 different “capsule performance” tables in the JWH D-Doc. This can be another worry in the due diligence process – can a manager run 17 world-class programs at once? And if not, which would you rather see: 17 mediocre programs, or 1 excellent one?
It’s a plausible story, but in this case, perhaps a more likely culprit in terms of “who’s minding the store” is the high manager turnover.
Manager turnover
So if the boss isn’t always running things, you had better have a very high level of confidence in whoever is picking up the slack. Leadership transitions are often due diligence red flags, but as it turns out – this one isn’t all that straightforward, either.
We’ll borrow heavily from Greg Newton in parsing the Disclosure Document and news clippings on Henry company hires here:
Like those stomach-churning drawdowns, management turnover is nothing new at JWH. Before Rzepczynski’s record tenure ended in January [Others shown the door at much the same time as Rzepczynski included long-time marketing executive Ted Parkhill; Bill Dinon, head of sales; and Andrew Willard, director of technology], past holders of the president title included Verne Sedlacek, now president and chief executive officer of Commonfund; Bruce Nemirow, now a principal of Capital Growth Partners, a third-party marketing company; and Ken Tropin, who, after a distinctly less than amicable split with Henry, went on to found Graham Capital Mgt Inc in 1994. That firm’s assets passed JWH’s several years ago.
Between Nemirow and Sedlacek, Peter Karpen, a former chairman of the Futures Industry Association; and David Bailin, now head of alternative investments at US Trust, held similar responsibilities, without the title of president.
It’s easy to look back on it in hindsight and say that a bunch of people jumping ship in 2007 was a bad sign, but consider how it looked in the moment: the person leaving had been there 9 years, while the person replacing him had been there 12 years. That certainly doesn’t look so bad, especially when compared with a program (Winton) which is just getting started or a management team with 5 years or less of experience.
Adapt or Die (but careful with those adaptations)
Did hubris play a part? Again, from Greg Newton:
JWH generally has not changed the fundamental elements of the portfolios due to short-term performance, although adjustments may be, and have been, made over time. In addition, JWH has not changed the basic methodologies that identify signals in the markets for each program. JWH believes that its long-term track record has benefited substantially from its adherence to its models during and after periods of negative returns; however, adherence to its strategy may lead to prolonged periods of market losses and high risk, according to its current disclosure document.
Did a stubbornness to adhere to the models which had worked in the 80s, 90s, and start of this century cause those models to become outdated? That seems doubtful. As we say around here, “Systems don’t break, they just become more risky.” It would appear that this is exactly what happened to JWH. Of course, some on the risk management side of a successful CTA might say that a model becoming more risky is the same thing as that model breaking. After all, the risk is the most important part. And we wouldn’t argue too much there.
In the end, it looks like it may have been the worst of both worlds for Hentry: sticking with the base models but tweaking the position sizing. Per page 34 of the JWH D-doc, we learn that the position sizing has been changed 16 times across 9 programs since 2003.  And these weren’t all position size reductions – many were increases. On one hand, if you are taking losses at a high trading level, then trying to gain those losses back at a reduced level, it’s going to take much longer to return to profitability. But if those losses we due to unresolved flaws in your trading method, raising your position sizes is just doubling down on a losing strategy.
Live and Die by the Volatility
Most of those in the industry will tell you John W. Henry was simply too volatile for modern tastes, and you can see when taking a look at his programs’ track records some big numbers on both sides. Take the financials & metals 36% annualized volatility for example, or the multiple years with above 40% gains or more than -17% losses, and you can see that Henry’s model was one of high risk for high return.
But it’s more than just the fact that the JWH programs were volatile – what stands out is how much more volatile they were than “normal” and the fact that they were getting more volatile compared to the competition.
John Henry Composite Volatility Comparison
The above look at the ratio between the JWH composite’s rolling 12mo annualized volatility and that of the BarclayHedge CTA Index shows that the JWH programs were about 2.25 times more volatile, on average, than the index during their boom times (the first 20 years), and had jumped to 3.49 times more volatile, on average, in the past 8 years.
Again, this is something more easily seen with hindsight, but this is easy enough to analyze in real time. It’s especially concerning how volatile a program is not just in absolute terms, but in relation to its benchmark as well. And if it’s 5 times more volatile – as JWH was a few times in 2008 – you had better be sure you are getting 5 times more the return as well.
Which brings us to…
You have to make money
At the end of the day in this business (or any other), no amount of name recognition nor bulletproof due diligence can make up for the failure to make money for your clients over a five year period, and that, more than anything else, led to John W. Henry closing up shop.
Consider the Financials & Metals program again. Heading into 2005 the program had never experienced back-to-back losing years. In fact, only once had the program suffered more than 1 losing year in any 7 year period (losing two out of three between 92 and 94). The program then saw losses in three consecutive years between 2005 and 2007, and when including this year’s down performance, the program has now lost money in 5 of the past 7 years.
John Henry Period Profitability
 The three years of losses ending in 2007 are likely what led to Merrill pulling the plug in that year (right before the program experienced a big bounce back, but that’s a topic for later), but the table above shows that something is materially different in the past eight years when compared to the first 20 for the Financials & Metals program.
A CTA’s job is twofold. First, to generate absolute return performance, so that a customer who gives the program at least three years to do its job will be rewarded with positive performance. And second, to stay ahead of the competition.
It’s no easy task, to be sure, and John Henry’s gold-lined trash cans are probably filled with the brochures of contenders who tried and failed. But since 2004, it has been Henry’s programs which have failed on both counts. They haven’t remained positive across the bulk of the rolling three year periods, with some of the rolling three year returns falling below -20%. And while those years haven’t been kind to many other CTAs, JWH failed to stay ahead of the competition. They spent most of the past eight years with rolling 36 month returns below that of the BarclayHedge CTA Index.
John Henry 36 Month Rolling Returns
Henry was lagging the index and seeing large negative 36 month returns as early as 2005, meaning there were chinks in the armor that appeared well before Merrill pulled the plug in 2007.  But pulling the plug on an underperforming advisor has to be one of the hardest things to do for the individual investor. Especially when you are considering pulling the plug on a Hall of Famer.
It’s all Relative
It’s a zero sum game, as managed futures detractors like to say. But the reality is that it is not that black and white. There isn’t always one clear winner and one clear loser. It’s more like a few thousand winners, a few thousand losers, and many more in between.
The job of the investor, then, isn’t necessarily to find the winner and avoid the loser, but to find the one doing a better job of winning than the others. What does that mean? Providing return with less volatility, more consistency, experiencing smaller drawdowns, shorter drawdowns – the list goes on.
Which brings us back to Henry. You see, while he is up (big time) in the zero sum game overall, the biggest takeaway for us following this pseudo-autopsy on the John W. Henry programs was in how the program started to become one of the worst winners according to our ranking algorithm.
The biggest warning flag to us was seeing how his ranking fell despite the program going on to make new equity highs.
You see, we don’t just rank on performance – we rank on comparative performance, across many time frames, and incorporate risk metrics to normalize the performance across programs. So you not only have to do well – you have to play the game better than the next guy in terms of controlling risk, delivering consistency, and more.
John Henry Attain Rankings
The fact that the John Henry programs started to fall in our rankings after their 1999 drawdowns is a sign of poor relative performance. In other words, they weren’t just doing poorly because of a bad managed futures environment – they were doing poorly AND performing worse than their peers were in that same environment. You can get away with rough years, but you can’t do worse than your peers for an extended period of time and hope to stay in the game.
Lessons Learned:
But do pay attention to the potential lessons within this story:
1.       Past performance is not necessarily indicative of future results. It’s not just a disclaimer, and the performance of the Henry Financials & Metals program shows the reality of that – with winning years in 17 out of its first 20 years followed by losing ones in 5 out of 7.
2.       Know what sort of program you are getting involved with. John Henry’s programs were notoriously high volatility, and willing to take larger losses in exchange for home-run type years - meaning  losses of -20% and more shouldn’t have surprised anyone.
3.       Beware the big brokerage house (Merrill Lynch types) selling a big brand name managed futures program. While Henry was a poster child for managed futures as late as 2004, there were warning signs for his programs well before that.  The big brokerages believe they are being conservative when selecting the well-known program with a long history of success, but they could be better served identifying lesser-known programs with the risk and reward profile their clients want. They are often late to the party and late to get out.
4.       Henry is still a Hall of Famer. Yeah, we know… we said there were warnings, his main program has our lowest ranking, and we wouldn’t recommend a JWH program for our clients. But having said all that, he also made a lot of money for a lot of people in his early days (and knowing how these things cycle he’ll likely go on to make himself another small fortune just by trading his own money). We’ve never met him, and don’t know what sort of person he is – but we’re willing to bet that many of the clients involved with him during the ‘80s and ‘90s still think he’s worthy of that hall of fame distinction. 

greed and fear

The biggest hurdle an investor faces are the twin emotions of greed and fear. Most gamblers don’t seem to be influenced by the latter, but the former is powerful enough.

Trading Strategies of the Rich and Famous: John W. Henry

Unless your a Red Sox fan, you might not have heard of John W. Henry. When it comes to the lexicon of great traders, John W. Henry doesn’t hold a candlestick chart to guys like Warren Buffett and Richard Dennis. But he should be there.
One thing you notice about great traders is there’s no such thing as a “pedigree.” They don’t all come from Ivy League schools. They don’t all start investing early. A lot of traders don’t even have a financial background.
Henry was from a farm family. He went to Victor Valley College and spent a stint at the University of California. What was his major? Finance? Economics? Nope. Philosophy. He didn’t graduate, by the way.
Despite this unconventional background, in the late 1970s, Henry began to trade. First, he traded something he was familiar with–soybeans and corn futures. But, Henry eventually created and tested a systematic trend trading strategy for multiple assets, mostly commodities.
The tests proved successful. That’s an understatement.
If you could reduce Henry’s trading strategy to its core principals, the two most significant would be:
1. Always be in the market.
Hold a basket of assets and either be in short or long positions, depending on the trend. (That last bit is key. You have to develop a systematic measure for determining the trend.)
2.  No emotions.
This is a mechanical system It’s not based on hunches. Or intuition. Or gut feel. Etc.
3. Fundamentals are not fundamental.
It may seem counter intuitive, but the analysis of fundamentals can be subjective. Like a child seeing shapes of cartoon figures in the clouds, a trader can see patterns in fundamentals that simply don’t exist. He or she is imprinting emotions on the numbers. All analysis must be objective and  devoid of emotions.
We believe that an investment strategy can only be as successful as the discipline of the manager to adhere to its requirements in the face of market adversity. Unlike discretionary traders, whose decisions may be subject to behavioral biases, our traders apply a disciplined investment process. By quantifying the circumstances under which key investment decisions are made, our methodology offers investors a rational approach to markets, unswayed by judgmental bias–from John W. Henry & Company website.
A more thorough summary of Henry’s methodology is available at his company’swebsite.
The system works apparently. If you remember the Barings bank debacle when Nick Leeson, a supposed rogue trader, made ridiculous bets on the Nikkei, Henry was on the winning side of that trade. The key was finding the trend.
“There are trends that tend to exist, whether they are capital flows or interest rates. So you can call trend following a blackbox, I guess, because some people refer to disciplined, mechanical-type trading as blackbox. But if you have enough discipline, or you only trade a few markets, you don’t need a computer to trade this way. It just makes it much, much more convenient for us.” – John W. Henry, Future’s Industry Association.
Henry fluctuates between billionaire and multi-millionaire status. (His net worth is currently estimated at $840 million.) A lifelong baseball fan, he owns the Boston Red Sox. He also owns the Liverpool Football Club.

William %R

Introduction

Developed by Larry Williams, Williams %R is a momentum indicator that is the inverse of the Fast Stochastic Oscillator. Also referred to as %R, Williams %R reflects the level of the close relative to the highest high for the look-back period. In contrast, the Stochastic Oscillator reflects the level of the close relative to the lowest low. %R corrects for the inversion by multiplying the raw value by -100. As a result, the Fast Stochastic Oscillator and Williams %R produce the exact same lines, only the scaling is different. Williams %R oscillates from 0 to -100. Readings from 0 to -20 are considered overbought. Readings from -80 to -100 are considered oversold. Unsurprisingly, signals derived from the Stochastic Oscillator are also applicable to Williams %R.

Calculation

%R = (Highest High - Close)/(Highest High - Lowest Low) * -100

Lowest Low = lowest low for the look-back period
Highest High = highest high for the look-back period
%R is multiplied by -100 correct the inversion and move the decimal.
The default setting for Williams %R is 14 periods, which can be days, weeks, months or an intraday timeframe. A 14-period %R would use the most recent close, the highest high over the last 14 periods and the lowest low over the last 14 periods.
Williams %R - Spreadsheet 1
Williams %R - Chart 1

Interpretation

As with the Stochastic Oscillator, Williams %R reflects the level of the close relative to the high-low range over a given period of time. Assume that the highest high equals 110, the lowest low equals 100 and the close equals 108. The high-low range is 10 (110 - 100), which is the denominator in the %R formula. The highest high less the close equals 2 (110 - 108), which is the numerator 0.2 divided by 10 equals 0.20. Multiply this number by -100 to get -20 for %R. If the close was 103, Williams %R would be -70 (((110-103)/10) x -100).
The centerline, -50, is an important level to watch. Williams %R moves between 0 and -100, which makes -50 the midpoint. Think of it as the 50 yard line in football. The offense has a higher chance of scoring when it crosses the 50 yard line. The defense has an edge as long as it prevents the offense from crossing the 50 yard line. A Williams %R cross above -50 signals that prices are trading in the upper half of their high-low range for the given look-back period. This suggests that the cup is half full. Conversely, a cross below -50 means prices are trading in the bottom half of the given look-back period. This suggests that the cup is half empty.
Low readings (below -80) indicate that price is near its low for the given time period. High readings (above -20) indicate that price is near its high for the given time period. The IBM example above shows three 14-day ranges (yellow areas) with the closing price at the end of the period (red dotted) line. Williams %R equals -9 when the close was at the top of the range. The Williams %R equals -87 when the close was near the bottom of the range. The close equals -43 when the close was in the middle of the range.

Overbought/Oversold

As a bound oscillator, Williams %R makes it easy to identify overbought and oversold levels. The oscillator ranges from 0 to -100. No matter how fast a security advances or declines, Williams %R will always fluctuate within this range. Traditional settings use -20 as the overbought threshold and -80 as the oversold threshold. These levels can be adjusted to suit analytical needs and security characteristics. Readings above -20 for the 14-day Williams %R would indicate that the underlying security was trading near the top of its 14-day high-low range. Readings below -80 occur when a security is trading at the low end of its high-low range.
Before looking at some chart examples, it is important to note that overbought readings are not necessarily bearish. Securities can become overbought and remain overbought during a strong uptrend. Closing levels that are consistently near the top of the range indicate sustained buying pressure. In a similar vein, oversold readings are not necessarily bullish. Securities can also become oversold and remain oversold during a strong downtrend. Closing levels consistently near the bottom of the range indicate sustained selling pressure.
Chart 3 shows Arch Coal (ACI) with 14-day Williams %R hitting overbought and oversold levels on a regular basis. The red dotted lines mark a move below -50 that occurs after an overbought reading. The green dotted lines mark a move above -50 that occurs after an oversold reading. As noted above, overbought is not necessarily bearish and oversold is not necessarily bullish. Top and bottom pickers can act when overbought or oversold, but it is often prudent to wait for a confirmation move. A move below -50 confirms a downturn after an overbought reading. A move above -50 confirms an upturn after an oversold reading.
Williams %R - Chart 2

Momentum Failure

The failure to move back into overbought or oversold territory signals a change in momentum that can foreshadow a significant price move. The ability to consistently move above -20 is a show of strength. After all, it takes buying pressure to push %R into overbought territory. Once a security shows strength by pushing into overbought territory more than once, a subsequent failure to exceed this level shows weakening momentum that can foreshadow a decline.
Williams %R - Chart 3
The chart above shows Cisco with 14-day %R. The stock was strong with numerous overbought readings from February to April. Even after the plunge below -80 in early April, %R surged back above -20 to show continuing strength. After a few more weeks of overbought readings, %R plunged to oversold levels in early May. This deep plunge showed strong selling pressure. The subsequent recovery fell short of -20 and did not reach overbought territory. This provided the second sign of weakness. After failing below -20, the decline below -50 signaled a downturn in momentum and the stock declined rather sharply. Another failure just below -20 in mid June also resulted in a sharp decline.
Williams %R - Chart 4
The chart above shows TJX Companies (TJX) with 28-day Williams %R. Chartists can adjust the look-back period to suite their analysis objectives. A longer time frame makes the indicator less sensitive. After becoming overbought in October, the indicator moved lower and became oversold twice in December. The January surge carried %R into overbought territory and the stock broke channel resistance. These were promising signs. On the subsequent pullback, %R held above -80 and did not become oversold. This showed underlying strength. The subsequent move above -50 foreshadowed a sharp advance over the next few months.

Conclusions

Williams %R is a momentum oscillator that measures the level of the close relative to the high-low range over a given period of time. In addition to the signals mentioned above, chartists can use %R to gauge the six month trend for a security. 125-day %R covers around 6 months. Prices are above their 6-month average when %R is above -50, which is consistent with an uptrend. Readings below -50 are consistent with a downtrend. In this regard, %R can be used to help define the bigger trend (six months). Like all technical indicators, it is important to use the Williams %R in conjunction with other technical analysis tools. Volume,chart patterns and breakouts can be used to confirm or refute signals produced by Williams %R.
Williams %R - Chart 5

Using with SharpCharts

Williams %R is available as an indicator for SharpCharts. The default setting is 14, but users can opt for a shorter timeframe to produce a more sensitive oscillator or a longer timeframe to produce a less sensitive oscillator. Once selected, the indicator can be place above, below or behind the underlying price plot. Click on “advanced options” to add a moving average, horizontal line or other indicator. A 3-day SMA can be added as a signal line. Click here for a live example.
Williams %R - Chart 6
Williams %R - SharpCharts

Suggested Scans

Williams %R Turns Up from Oversold Levels: This scan searches for stocks that are trading above their 200-day moving average to define a long-term uptrend. A pullback is identified when %R moves below -80 and a subsequent upturn occurs when %R moves above -50.
Williams %R Turns Down from Overbought Levels: This scan searches for stocks that are trading below their 200-day moving average to define a long-term downtrend. An oversold bounce is identified when %R moves above -20 and a subsequent downturn occurs when %R moves below -50.

Classic Trend Following Advice from John W. Henry the Owner of the Boston Red Sox


If there was a Hall of Fame for trend followers the owner of the Boston Red Sox would be in it. A piece of timeless wisdom from John W. Henry:
How are we able to make money by following trends year in and year out? I think it’s because markets react to news, but ultimately major change takes place over time. Trends develop because there’s an accumulating consensus on future prices, consequently there’s an evolution to the “believed true price value” over time. Because investors are human and they make mistakes, they’re never 100 percent sure of their vision and whether or not their view is correct. So price adjustments take time as they fluctuate and a new consensus is formed in the face of changing market conditions and new facts. For some changes, this consensus is easy to reach, but there are other events that take time to formulate a market view. It’s those events that take time that form the basis of our profits.

Saturday, March 21, 2015

Investment


Use:
Guppy
EMA 8 14
RSI

to time the enter and exit of good FA stock

all psychological

use both fundamental and TA

but I cant use fundamental, no way to match big research company....


TA can only be use short term trading, not long term,,,

so find good FA stock, monitor and wait for the price to crash and then buy

FA cant be use ??? so how to know when is the bottom.. ??
but it reflect the psychological thinking of the masses at he time, so use to gaude the thinkinh of these investors, thus can be use for Guppy....

Is Technical Analysis a Waste of Time?

There are some investors who believe they can profit by finding patterns in historical stock prices or trading volume. These investors are attempting to profit from technical analysisKevin Grogan, my colleague at Buckingham Asset Management, reviewed some evidence on these strategies and found that these investors could probably find a more productive use for their time.

William Eckhardt (trader)

William Eckhardt is a commodities and futures trader and fund manager. He began trading in 1974 after four years of doctoral research at the University of Chicago in mathematical logic.

Education

Eckhardt never finished his PhD in mathematics, claiming that he left graduate school for the trading pits after an unexpected change of thesis advisors. Despite leaving academia prematurely, Eckhardt has published several papers in academic journals. In 1993, Eckhardt's article "Probability Theory and the Doomsday Argument" was published in the philosophical journal Mind. His follow-up article, "A Shooting-Room view of Doomsday" was published in The Journal of Philosophyin 1997. Both articles make arguments skeptical of the Doomsday Argument as formulated by John Leslie. In 2006, he published "Causal time asymmetry" in the journal Studies In History and Philosophy of Modern Physics.

Career

In 1991 he founded Eckhardt Trading Company ("ETC"): an alternative investment management firm, specializing in the trading of global financial futures andcommodities, which manages over $1 billion in managed accounts, domestic and offshore products. The firm's international clientele includes "fund of funds", corporate, private, and institutional investors.
Having a strong analytical and mathematical background, Eckhardt believes that the correct application of statistics and mathematical concepts is key for successful trading.[1] However, he highlights the difficulties in using these concepts, mentioning that "the analysis of commodity markets is prone to pitfalls in statistical inference, and if one uses these tools without having a good foundational understanding, it’s easy to get in trouble".
Prior to founding ETC, Eckhardt was also involved in the Turtle Trading experiment,[2] set up by partner, friend and fellow trader Richard Dennis. The goal of that experiment was to settle a philosophical disagreement between the two partners, to determine whether the skills of a successful trader could be reduced to a set of rules (i.e. can trading be taught?). The experience was overwhelmingly successful with novice traders ending up making $100 million. Eckhardt, who believed trading could not be taught, had effectively lost his bet with Dennis.

Gann studies have been used by active traders for decades and, even though the futures and stock markets have changed considerably, they remain a popular method of analyzing an asset's direction. New trading areas, such as the foreign exchange market and the invention of exchange-traded funds (ETFs) have also made it necessary to revisit some of the construction rules and application concepts. Although the basic construction of Gann angles remains the same, this article will explain why the changes in price levels and volatility have deemed it necessary to adjust a few key components. (For background reading, see A Discussion of Gann or The Gann Studies)

Basic Elements of Gann Theory
Gann angles are a popular analysis and trading tool that are used to measure key elements, such as pattern, price and time. The often-debated topic of discussionamong technical analysts is that the past, the present and the future all exist at the same time on a Gann angle. When analyzing or trading the course of a particular market, the analyst or trader tries to get an idea of where the market has been, where it is in relation to that former bottom or top, and how to use the information to forecast future price action.
Gann Angles Versus TrendlinesOf all of W.D. Gann's trading techniques available, drawing angles to trade and forecast is probably the most popular analysis tool used by traders. Many traders still draw them on charts manually and even more use computerized technical analysis packages to place them on screens. Because of the relative ease traders today have at placing Gann angles on charts, many traders do not feel the need to actually explore when, how and why to use them. These angles are often compared to trendlines, but many people are unaware that they are not the same thing. (To learn about trendlines, see Track Stock Prices With Trendlines.)
A Gann angle is a diagonal line that moves at a uniform rate of speed. A trendline is created by connecting bottoms to bottoms in the case of an uptrend and tops to tops in the case of a downtrend. The benefit of drawing a Gann angle compared to a trendline is that it moves at a uniform rate of speed. This allows the analyst to forecast where the price is going to be on a particular date in the future. This is not to say that a Gann angle always predicts where the market will be, but the analyst will know where the Gann angle will be, which will help gauge the strength and direction of the trend. A trendline, on the other hand, does have some predictive value, but because of the constant adjustments that usually take place, it's unreliable for making long-term forecasts.
Past, Present and FutureAs mentioned earlier, the key concept to grasp when working with Gann angles is that the past, the present and the future all exist at the same time on the angles. This being said, the Gann angle can be used to forecast support andresistance, strength of direction and the timing of tops and bottoms.
Gann Angles Provide Support and Resistance
Source: TradeStation
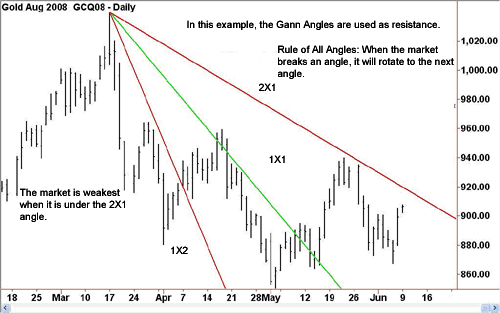
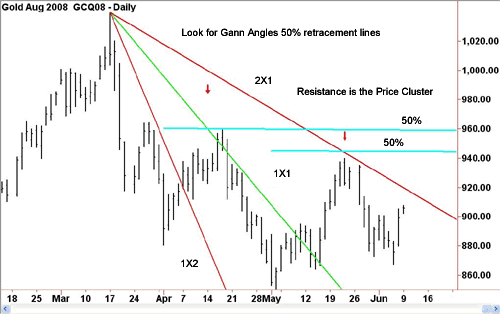
Using a Gann angle to forecast support and resistance is probably the most popular way they are used. Once the analyst determines the time period he or she is going to trade (monthly, weekly, daily) and properly scales the chart, the trader simply draws the three main Gann angles: the 1X2, 1X1 and 2X1 from main tops and bottoms. This technique frames the market, allowing the analyst to read the movement of the market inside this framework.
Uptrending angles provide the support and downtrending angles provide the resistance. Because the analyst knows where the angle is on the chart, he or she is able to determine whether to buy on support or sell at the resistance.

Traders should also note how the market rotates from angle to angle. This is known as the "rule of all angles". This rule states that when the market breaks one angle, it will move toward the next one.
Gann Angles Determine Strength and Weakness
Source: TradeStation
The primary Gann angles are the 1X2, the 1X1 and the 2X1. The 1X2 means the angle is moving one unit of price for every two units of time. The 1X1 is moving one unit of price with one unit of time. Finally, the 2X1 moves two units of price with one unit of time. Using the same formula, angles can also be 1X8, 1X4, 4X1 and 8X1.
A proper chart scale is important to this type of analysis. Gann wanted the markets to have a square relationship so proper chart paper as well as a proper chart scale was important to his forecasting technique. Since his charts were "square", the 1X1 angle is often referred to as the 45-degree angle. But using degrees to draw the angle will only work if the chart is properly scaled.
Not only do the angles show support and resistance, but they also give the analyst a clue as to the strength of the market. Trading on or slightly above an uptrending 1X1 angle means that the market is balanced. When the market is trading on or slightly above an uptrending 2X1 angle, the market is in a strong uptrend. Trading at or near the 1X2 means the trend is not as strong. The strength of the market is reversed when looking at the market from the top down. Anything under the 1X1 is in a weak position. (For more insight, readGauging The Strength Of A Market Move.)

Gann Angles Can be Used for Timing
Source: TradeStation
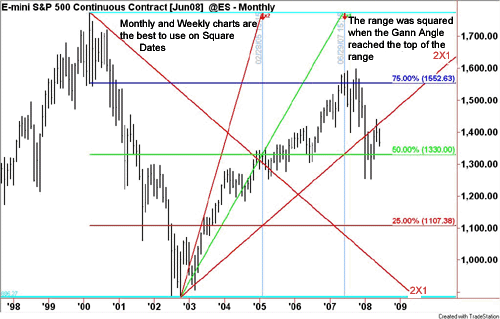
Finally, Gann angles are also used to forecast important tops, bottoms and changes in trend. This is a mathematical technique known as squaring, which is used to determine time zones and when the market is likely to change direction. The basic concept is to expect a change in direction when the market has reached an equal unit of time and price up or down. This timing indicator works better on longer term charts, such as monthly or weekly charts; this is because the daily charts often have too many tops, bottoms and ranges to analyze. Like price action, these timing tools tend to work better when "clustered" with other time indicators.
ConclusionGann angles can be a valuable tool to the analyst or trader if used properly. Having an open mind and grasping the key concept that the past, present and future all exist at the same time on a Gann angle can help you analyze and trade a market with more accuracy. Learning the characteristics of the different markets in regard to volatility, price scale and how markets move within the Gann angle framework will help improve your analytical skills.

John W. Henry: Top Trader


Wisdom from John W. Henry:
I don’t believe that I am the only person who cannot predict future prices. No one consistently can predict anything, especially investors. Prices, not investors, predict the future. Despite this, investors hope or believe that they can predict the future, or someone else can. A lot of them look to you to predict what the next macroeconomic cycle will be. We rely on the fact that other investors are convinced that they can predict the future, and I believe that’s where our profits come from. I believe it’s that simple… when I was designing what turned out to be a trend following system…[that] approach–a mechanical and mathematical system–has not really changed at all. Yet the system continues to be successful today, even though there has been virtually no change to it over the last 18 years.
If one theme summarizes Henry’s philosophy, it is the knowledge that one cannot predict anything. Henry is a long-term follower. His philosophy is based on the premise that market prices, rather than market fundamentals, are the key aggregation of information needed to make investment decisions. He says, The markets are people’s expectations, and these expectations manifest themselves as price trends. We live in an uncertain world. One cannot predict the future of anything. In an uncertain world, identifying and following trends may be the only reasonable investment approach over the long term. Henry feels that a mechanical approach has more value since no scientific approach or solid testing can be applied to discretionary trading. Henry says that when he first researched the markets in the 1970s, he was looking for a methodology that would work through many market conditions. His research showed that long-term approaches work best over decades. There is an overwhelming desire to act in the face of adverse market moves. Usually it is termed ‘avoiding volatility’ with the assumption that volatility is bad. However, I found avoiding volatility really inhibits the ability to stay with the long-term trend. The desire to have close stops to preserve open trade equity has tremendous costs over decades. Long-term systems do not avoid volatility, they patiently sit through it. This reduces the occurrence of being forced out of a position that is in the middle of a long-term major move.

Q&A With John W. Henry

Q. How did you get started in money management, and what advice could you give to someone who would be interested in following in your footsteps?
A. How did I get started? I was hedging crops for farmland that I owned in a couple of states. I just seemed to do fairly well trading by the seat of my pants. It was a broker at Reynolds Securities in those days that asked me if I would manage money for farmers, because I seemed to do so well in the grain markets. That is sort of how it all started. I said no to hedging for farmers. I spent five years working on some ideas I had for trading, and one thing led to another. I came up with a [trend following] philosophy.

Larry Williams

Larry Williams is a well known commodities trader and author with materials dating back to the early eighties. In these past three decades he has written several best sellers and has secured his reputation as a trading expert.
There are several reasons why Larry Williams and his books have become so popular. He gained much credibility when a book that he published correctly predicted the upswing of the market at a time when the majority was forecasting a slowdown.
Moreover, Larry Williams shocked people in 1987 with his impressive results at the Robbins World Cup Trading Championship. Throughout the event Williams was able to turn $10,000 into a little more than one million dollars. To this day results like that haven’t been reported; supposedly this is why some have accused him of foul play at that tournament.
Larry Williams is also known for developing and teaching his own trading system. His methods have been called unconventional and at times risky. However, each trader should have their own system that is tailored to their financial situation, risk/loss threshold, and emotions.
His trading style does not rely heavily on charts so much as it does on indicators and timing tools that he has personally developed. These are known as the Williams %R and the Ultimate Oscillator.


Sunday, December 7, 2014

独一无二

我很平凡,但独一无二


人,是活给自己看的。别奢望人人都懂你,别要求事事都如意。苦累中,懂得安慰自己。没人心疼,也要坚强;没人鼓掌,也要飞翔;没人欣赏,也要芬芳。


亲爱的自己,从今天起,让自己平平淡淡的活着,学着爱自己,你是独一无二的,做个最真实最快乐最阳光的自己。
亲爱的自己,全世界就一个独一无二的你,就算没有人懂得欣赏,你一定要好好爱自己,放轻松,做最真实的自己。
不要再炫耀性感------这个年龄的男人最吸引人的是沉稳与优雅。

人生只有三天,迷惑的人活在昨天,奢望的人活在明天,只有清澈的人活在今天。昨天已经过去,是过了期的支票,明天还没有来到,是不可提取的支票,只有活在今天是最现实的。

我们的思想总是在过去和未来,但是我们的身体和呼吸却永远是在当下。

中年以后,过一天,少一天;过一天,乐一天;过一天,赚一天。

【不要等到明天】
1.改变一种行为不要拖到明天,否则它会变成你的习惯。
2.拒绝一份诱惑不要拖到明天,否则它会造成你的伤害。
3.抓住一次机会不要拖到明天,否则失去了就不会再来。
4.不要让今天的行动拖到明天,否则它无法带来精彩。
5.不要把今天的幸福拖到明天,否则它将一去不复返。
6.不要把机会拖到明天,因机会是唯一的你还要等到明天吗?


人生,只有今世,没有来世,人生的每一分每一秒都是那么的弥足珍贵。不要以为时间还早,不要以为年纪还小,不要以为生命很长,不要以为过了今天还有明天过了明天还有后天,每个人都不知道死亡和明天哪一个会先来。明日复明日,明日何其多!我生待明日,万事成蹉跎。

我们能做的,必须要做的,就是把握今生,把握今天,并开心快乐的好好活着,甚至连生气的时间,抱怨的心态,都不该有!

人生,只有今生,没有来世。下辈子不过是一个虚无缥缈的梦。

人生,很短暂,只有区区几十年。
  
人生,只有今世,没有来世,人生的每一分每一秒都是那么的弥足珍贵。不要以为时间还早,不要以为年纪还小,不要以为生命很长,不要以为过了今天还有明天过了明天还有后天,每个人都不知道死亡和明天哪一个会先来。明日复明日,明日何其多!我生待明日,万事成蹉跎。我们能做的,必须要做的,就是把握今生,把握今天,并开心快乐的好好活着,甚至连生气的时间,抱怨的心态,都不该有!

人生,只有今世,没有来世,不能活在童话里。转世投胎的神话其实都是骗人的鬼话,是编故事的人一厢情愿的善意的谎言,我们不是神仙妖怪不能死而复生,我们不是九头鸟可以九死九生,我们也不是梁山伯祝英台不可能死后变成翩翩蝴蝶……
  
人生,只有今生,没有来世,别奢望有什么下辈子。生命只有一次,每个生命都是一个奇迹,每个生命都无比珍贵。生命是父母给的,不可以挥霍。生命是祖先的血脉,不可以作贱。好好活好这辈子,最最重要!
  
人生,只有今生,没有来世。没有什么比活着更好,活着是最灿烂的辉煌,因为只有活着才有欢笑,才有幸福,才有灵动,才有感动和辉煌。
  
人生,没有下辈子,当不虚此生!


时间去哪了

等将来……
等不忙……
等下次……
等有时间……
等有条件……
等有钱了……
等来等去 ……
等没了缘分……
等没了青春……
等没了健康……
等没了机会……
等没了选择……
等没了美丽……

谁也无法预知未来,很多事情可能会一等就等成了永远!

想要做的事就赶紧去做,不要给自己留下太多的遗憾!

Total Risk in Dover..... Second Chance.....Grab it
Total Risk in CCS


Socrates:Where are you?

Dan Millman: Here.

Socrates: What time is it?

Dan Millman: Now.

Socrates: What are you?

Dan Millman: This moment.


不要让‘垃圾人’接管自己生活当中的任何一天!

人生短暂,绝对不要浪费心思和精力在这些事上!


对别人生气1分钟,
就失去了自己人生中60秒的快乐。


孝庄对康熙说:“孙儿,大清国最大的危机不是外面的千军万马,最大的危难,在你自己的内心”。

不要在意别人在背后怎么看你说你, 因为这些言语改变不了事实,却可能搅乱你的心。

心如果乱了,一切就都乱了。

人的差别来源于学习,经常抽出时间用来阅读、学习、思考,你会发现,你的人生会发生改变,成功会向你招手。

改变一下自己的态度去适应不同的情况,心情轻松舒畅,不要心郁气结,跟自己过不去。人到老年,什么事都看透了,无论如何自己不要跟自己过不去,一定要善待自己莫烦恼。


脾气越大身体越差,脾气越温福报越深;
声音越大修养越差,声音越柔德行越厚;
性子越急智慧越低,性子越稳智慧越深;


托尔斯泰说:“世界上只有两种人:一种是观望者,一种是行动者。大多数人都想改变这个世界,但没有人想改变自己。

”要改变现状,就得改变自己,要改变自己,就得改变自己的观念。一切成就都是从观念开始的,一连串失败,也都是从错误的观念开始的。

原来,一个人内心怎样看待自己,在外界就能感受到怎样的眼光。

一个从容的人,感受到的多是平和的眼光;
一个自卑的人,感受到的多是歧视的眼光;
一个和善的人,感受到的多是友好的眼光;
一个叛逆的人,感受到的多是挑惕的眼光……
只有你自己,才能决定别人看你的眼光


无论是追求幸福、宁静、安全……都到你内心去寻找吧,那里有无穷无尽的资源和能量。

“亲爱的,外面没有别人,只有你自己”。


嘴巴是别人的,人生才是自己的

太在乎别人评价的人,不会获得快乐,活在别人的是非中,在自寻烦恼。


嘴巴是别人的,人生是自己的,有习惯性被人家嘴巴“虐待”的人,请用左脑右脑想一想:为什么我要当人家嘴巴的奴隶?

世上的很多事都是难以预料的,成功常常伴随着失败,失败往往孕育着成功;好事会变为坏事,坏事也会变为好事。

人的一生,本来就是成败相随,好坏更替的统一体。

换一种心态就能换一种方式生活。一个乐观的人,在生活中,就能够笑看输赢得失,而不只认最终胜负,他们深信未来,也不抱怨现状,能够利用自己的优势,发挥自己的潜能,一步步向上攀登,而走向成功。


善待自己,使自己成为最好的,比善待别人更有意义。我们除了学会律己,宽容别人,成全别人之外,还要学会成全自己,宽容自己,给自己更多的时间和空间,来不断发展和完善自己。


人生四不要
1、不要把烦恼带到床上,因为那是一个睡觉的地方。
2、不要把怨恨带到明天,因为那是一个美好的日子。
3、不要把忧郁传染给别人,因为那是一种不道德的行为。
4、不要把不良的情绪挂在脸上,因为那是一种令人讨厌的表情。从今天开始,每天坚持以上四点。


每晚睡前,原谅所有的人和事。闭上眼睛,清理你的心,过去的就让它过去吧。无论今天发生多么糟糕的事,都不应该感到悲伤。一辈子不长,用心甘情愿的态度,过随遇而安的生活。

学会原谅
人的一生中会遇到不顺心的事,会碰到不顺眼的人,如果你不学会原谅,就会活得很痛苦,活得很累。

原谅自己不能成就伟业,不能出人头地;原谅自己不能才华横溢,没有成为百万富翁;原谅自己,不要紧紧抓住自己的弱点、缺点、过失不放,太苛求自己,只会使自己丧失自信和勇气,使自己失去阳光心态;要放下包袱,给自己解压,相信平淡的生活照样会风光无限,旖旎无限。

当你原谅了一切之后,你会发现:你其实已经上升了一个高度。

只要有人的地方就有是非;只要人家有嘴巴,就会有意见和批评。再者,太在意别人想法的人,不仅不能快乐,也容易失去自己的特色和个性,更没办法发挥自己的潜能。


得与失在我们心中,只有一线之隔,我们意以为得,就是得意;意以为失,就是失意。能够悟透得失的人,才会有快乐的人生。

一份好的心情,不仅仅可以改变自己,同时更会感染他人,如果你想做一个快乐的人,那么,你一定要保持十八岁的心情。


人与人之间的差别示仅在于才华,还在于意志力。一个人笨一点不怕,只要他勤谨,有追求上进的抱负心,成功的果实早晚会被他摘到。龟兔赛跑的故事人皆共知.


「人定胜天」这句成语,很久以来一直被人误用。其实它的本意是:人心安定(安守在自己的本位上)这个力量能改变一切。并不是说人类一定能战胜大自然。定是安定、禅定之意,而不是一定之意。可是很多人没有明白它的意思,误以为人能战胜大自然,而恣意掠夺破坏大自然,误解了古圣先贤真实意。

跟自己说声对不起,因为我让自己不开心。

跟自己说声对不起,因为忘了提醒自己要好好照顾自己。

跟自己说声对不起,因为总是和别人说对不起,而忘了自己。

最后,说完对不起之后,生活还要继续。我只是想让自己开心一点,不要难过。所以,我微笑着原谅了自己。

心态不好,你注定是个弱者!

心态决定人生
一位哲人说过:“你的心态就是你的主人。”在现实生活中,我们不能控制自己的遭遇,却可以控制自己的心态;我们不能改变别人,却可以改变自己。


生气不如争气
人生有顺境也有逆境,不可能处处是逆境;人生有巅峰也有谷底,不可能处处是谷底。因为顺境或巅峰而趾高气扬,因为逆境或低谷而垂头丧气,都是浅薄的人生。面对挫折,如果只是一味地抱怨、生气,那么你注定永远是个弱者。

有自信才能赢
自信是一种力量,更是一种动力。当你不自信的时候,你难于做好事情;当你什么也不做不好时,你就更加不自信。这是一种恶性循环。若想从这种恶性循环中解脱出来,就得与失败作斗争,就得树立牢固的自信心。

心动更要行动
心动不如行动,虽然行动不一定会成功,但不行动则一定不会成功。


别把挫折当失败
每个人的一生,难免都会遭受挫折和失败。所不同的是失败者总是把挫折当失败,从而使每次都能够深深打击他取胜的勇气;成功者则是从不言败,在一次又一次的挫折面前,总是对自己说:“我不是失败了,而是还没有成功。”一个暂时失利的人,如果继续努力,打算赢回来,那么他今天的失利,就不是真正的失败。相反的,如果他失去了再战斗的勇气,那就是真输了。


一份工作,一种专长,一项本业,做得好, 都少不了一样东西:专注力。所谓专注力,就是在工作上,事业上,生意上,能心无旁骛,全身心投入。一件事情,只有全身心投入去做了,才能超越常人,能别人之不能。所谓台上十分钟,台下十年功;别只看到别人抛头露面的风光,也要明白,在台下,另有你不曾看见过的十年孤寂、隐忍、修炼、磨炼,以及坚持。


寿命

1、经常自己找气生的人,即小心眼,如林黛玉,一般活20-50岁;

2、经常受别人气的人,叫佣人,一般活50-60岁;

3、经常自我生气,也常气别人的人,叫俗人,如普通百姓,一般活60-70岁;

4、经常让别人生气,自己却不太生气的人,叫伟人,如毛泽东,一般活80岁左右;

5、不论别人怎么气你也能淡然处之,叫高人,如朱德、邓小平,一般活90岁左右;

6、从不气别人,自己也不生气,叫真人,如孙思邈、张学良,一般能活百岁或以上!


百病皆生于气!
消气法      (分九个层次,逐级提升):
1.倾诉; 

2.回避 ;
3.运动;
4.娱乐;
5.想得开;
6.自己想适合自已的方法;
7.换位思考;
8.放得下;
9.提高境界!

我深信当你把你的内在世界调整得很好的时候,你的外在世界就会自然而然变得很顺利。

你的问题主要在于读书不多而想得太多。


活在当下 ,此话来自禅修。禅师们认为,活在当下就是:该吃饭时吃饭,该睡觉时就睡觉,该高兴时就高兴,也就是说该干什么时就干什么。如果不是这样的话,那可能是活在过去,或活在未来。如,两个仇人相见时,彼此对以往的仇恨现在还耿耿于怀,说明此时的他们不是活在当下,而是活在过去的仇恨中。对于每个人来说,过去是永远的记忆,不管过去多么荣耀或失意,过去的已过去,未来正在当下演变。关于未来,与其忧心忡忡,不如愉快地做好当下种种。活在当下就是一个人的生命力自然呈现。


在这物欲横流的人世间,人生一世实在是够苦。你存心做一个与世无争的老实人吧,人家就利用你欺侮你。

你稍有才德品貌,人家就嫉妒你排挤你。你大度退让,人家就侵犯你损害你。

你要不与人争,就得与世无求,同时还要维持实力准备斗争。你要和别人和平共处,就先得和他们周旋,还得准备随时吃亏。


人,最可怕的是给自己负能量的暗示。为自己画地为牢的人,也许永远走不出来那个圈圈。记着,我们都是这世界上最强的人,别人说你是“坏”人,不要紧,只要我们自己认定还是个“好”人就行。别人觉得你这不行,那不行,只要我们足够信心,知道我一定能做好就行。


说你的人多,帮你的人少

忙了一辈子究竟什么是你的?

一、世界上到底什么是你的,这个问题可能有好多的人想弄清楚?

1、爱人是你的吗?不是。
2、子女是你的吗?不是。
3、金钱是你的吗? 不是。
4、房子和车是你的吗? 不是。


那么究竟什么是你的呢?
你的身体。
只有它才是始终不离不弃的陪伴你的生命,走完人生的全部历程。 只有它才能拼命地呵护、保护你的生命, 直到耗尽它全部的能量为止。如果你的身体健康状况越好, 陪你所走的路程就越远。

没有了身体,你的生命也就终止了。因此, 你要把这唯一属于你的东西“身体”,看做无价之宝,爱护它、 满足它的一切需求。锻炼、营养、作息、防病治病、讲究卫生、 心情舒畅、不受伤害等等一切保护性的措施全部跟上, 一刻也不能松懈。


身体健康,生活才会有质量。
身体健康,生命就会长。
没有了健康的身体,就没有了生命。
有了生命就拥有了一切。
没有了生命,一切就都不是你的了。
所以我们只要活着一天,就是福气,就该珍惜。

没有任何东西比得上健康。保护好自己的身体,珍惜你现在拥有的!

新时代人生新标准:
1、最聪明的人:老玩,老乐,老豁达,老幽默;
2、最呆傻的人:老急,老气,老郁闷,老加班;
3、最健康的人:老走,老动,老锻炼,老拥抱;
4、最快乐的人:老说,老笑,老联系,老给朋友圈发微信!
没有健康一切为零。


如果没有人相信你,那就自己相信自己;

如果没人欣赏你,那就自己欣赏自己;

如果没人祝福你,那就自己祝福自己。
如果别人都不爱你了,你再不好好爱自己,那不是太对不起自己了

无任别人如何看不起你,你都要有自信。 别人如何打击你, 你也要坚强。 活在当下。 ....无论别人如何伤害你,你都要原谅他 。 ....无论你自己有何不完美,你都要原谅自己 。。。我不是完美,但我独一无二。。。。没有人是十全十美。。。。。就祘没人爱你。你也要爱你自己

生活,不会因你抱怨而改变;人生,不会因你惆怅而变化。你怨或不怨,生活一样;你愁或不愁,人生不变。抱怨多了,愁的是自己,惆怅多了,苦的还是自己。你哭,生活不会流泪,你苦,生活不会烦恼。既然如此,何不微笑?既然这样,何必惆怅?

自信是成功的源泉!用心去触摸属于自己的阳光,用爱去创造属于自己的世纪!自己读懂了自己,世界才能读懂你。


亲爱的自己,从今天起,让自己平平淡淡的活着,学着爱自己,你是独一无二的,做个最真实最快乐最阳光的自己。


亲爱的自己,不要太在意一些人,太在乎一些事,顺其自然,用最佳心态面对一切,因为世界就是这样,往往在在乎的事物面前,我们会显得没有价值。

亲爱的自己,永远不要为难自己,比如不睡觉、不吃饭、难过、自责,这些都是傻瓜做的事。


亲爱的自己,相信自己的直觉,不要随随便便招惹别人,也不要让别人随随便便走进你的世界招惹你。

亲爱的自己,全世界就一个独一无二的你,就算没有人懂得欣赏你一定要好好爱自己,放轻松,做最真实的自己。

忘记昨日所有过的烦恼;
今日依然是初升的太阳!


你能够,
忘记你的过去,
看重你的现在,
乐观你的未来时,
你就站在了生活的最高处。


I don’t believe that I am the only person who cannot predict future prices. No one consistently can predict anything, especially investors. Prices, not investors, predict the future
 .


没有一个人,一生没有坎坷;没有一个人,一世没有痛苦。

说你的人多,帮你的人少。


1、相信自己、用微笑迎接生活和工作中的各种考验。

2、激励自己、用行动和努力来证明自己不比别人差。
3、鼓舞自己、让自己时刻保持一颗上进的心。
4、磨练自己、让自己的心性保持平和。
5、完善自己、让自己尽量达到完美。
6、忘却自己、使自己心境平和。


亲爱的  你离开自己多久了


自从来到这个世界上

就被父母教导
要听话,才会有奶喝
要乖,才不会挨骂
要做的好,才会被赞扬


我成为了一个好人
我沾沾自喜
我彻底忘了自己是谁

可是

我还是会消极
我还是会失败
我还是会懒惰
我还是会悲伤
我还是会粗鲁
我还是会痛苦
我还是会阴暗
我依旧缺乏自信

于是我对抗自己的负面和阴暗
我以它们为耻
我把它们丢弃在某个看不见的角落


当我遗弃它们
我也遗弃了自己  
爱自己就要接受自己所有的一切!
没有好的,坏的,对的,错的,光明的,黑暗的,接受自己的一切!
一切都是那么的完美!


人的一生须练就两项本领:一是说话让人结缘,二是做事让人感动。“恶语伤人心,良言利于行”。

古人说:口能吐玫瑰,也能吐蒺藜。修炼口德,就是修炼自己的气场,一身正气才能好运多多。口德好才能运势好,运势好才能少走弯路,多些成就。

恶言不出口,苛言不留耳。这是我们应该具有的修养,有了这样的修养,你就能化腐朽为神奇,风生水起好运来。出言不慎,驷马难追。


不知而说,是不聪明;知而不说,是不忠实。君子言简而实,小人言杂而虚。


良药苦口利于病,忠言逆耳利于行。快乐之时说话,没信用的多;愤怒之时说话,失礼节的多。面责人之短,人虽不悦,未必深恨。背地言其短,令人不悦,怀恨甚深。不必说而说,是多说,多说易招怨;不当说而说,是瞎说,瞎说易惹祸。君子一言当百,小人多言取厌,虚言取薄,轻言取侮。对失意者,莫谈得意事;处得意日,莫忘失意时。喜闻过者,忠言日至;恶闻过者,谀言日增。


言不可轻说,若说话更改,不如不说;言不可轻诺,若应诺更改,不如不诺。所以一言半诺,俱宜谨慎为要。有道德、信义、智谋者,必不多言;惟小人、狂人、妄人者,必会多言。言不中理,不如不言,一言不中,千言无用。口舌祸之门,灭身之斧也。


最难得不是别人的拒绝与不理解,而是你愿不愿意为你的梦想而作出改变!


生活总是现实的,穷人用悬崖来自尽,富人用悬崖来蹦极,这就是穷人与富人的区别。

你受得了何种委屈,决定你能成为何种人。我是一切的根源,要改变一切,首先要改变自己。学习是改变自己的根本,你爱的是你自己,你爱的,你恨的,都是你自己。

你变了,一切都变了。你的世界是由你创造出来的,你的一切都是你创造出来的,你是阳光你的世界充满阳光,你是爱你就是生活在爱的氛围里,你是快乐你就在笑声里,同样的,你每天抱怨、挑剔、指责、怨恨,你就生活在地狱中。


伟大都是熬出来的,为什么用熬,因为普通人承受不了的委屈你得承受,普通人需要别人理解安慰鼓励,你没有,普通人用对抗消极指责来发泄情绪,但你必须看到爱和光,在任何事情上学会转化,消化,普通人需要一个肩膀在脆弱的时候靠一靠,而你就是别人依靠的肩膀。

面对失败,不要太计较,天将降大任于斯人也,必先苦其心志,劳其筋骨,饿起体肤……

Self Talk